
Sellers Sales Dashboard
最后更新: 2026年7月3日
Sellers Sales Dashboard
The Sales Dashboard offers a comprehensive overview of sales performance metrics and key performance indicators (KPIs) in a clear, easily digestible format. Below is a breakdown of the Sellers Sales Dashboard.
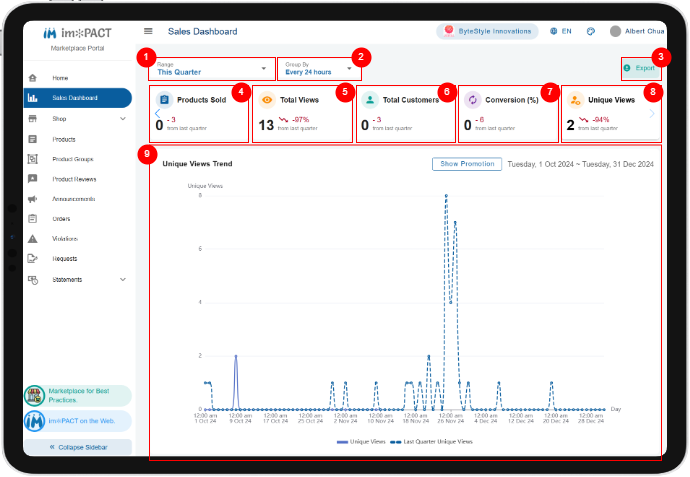

Time Period:
You may choose the reporting time period to review your sales. It can be by week, month, quarter, year to date or by a custom date range.
Periodic Interval (Hours):
You may select how frequent is the reporting based on hours.

Export:
You can export your sales data into a report.
Hidden Total Sales:
This is the total sales amount for all the products sold for the reporting period.

Products Sold:
This is the total number of products sold for the reporting period.

Total Views:
This is the total views for your all your products for the reporting period.

Total Customers:
This is the total customers who bought your products for the reporting period.

Conversion (%):
This is the rate of conversion from visitors to customers for the reporting period.

Total Customers:
This is the total unique views (by visitor's IP address) for all your products for the reporting period.

Trend Chart:
This chart displays the trend for your sales, products sold, total views and etc. It changes according to the type of trend which is selected.